Management Indices
Consolidated
| 2021/9 |
2022/9 |
2023/9 |
2024/9 |
2025/9 |
|
|---|---|---|---|---|---|
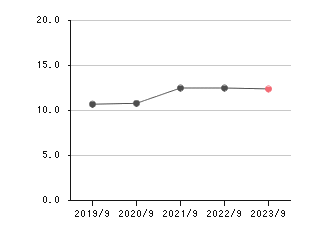
| Operating income margin (%) | 12.5 | 12.5 | 12.4 | 9.2 | 10.9 |
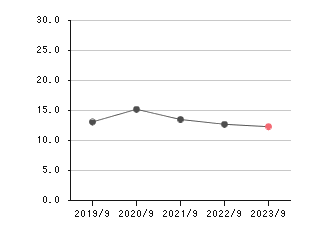
| Return on assets (%) | 13.5 | 12.7 | 12.3 | 9.7 | 10.4 |
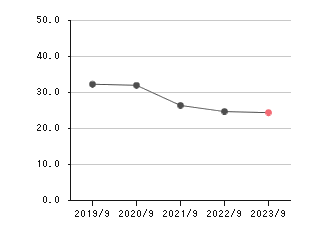
| Return on equity (%) | 26.4 | 24.7 | 24.4 | 21.1 | 20.1 |
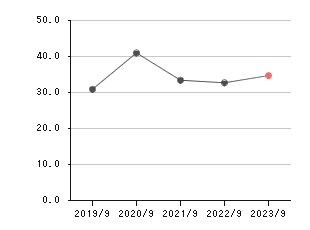
| Equity ratio (%) | 33.4 | 32.7 | 34.7 | 36.2 | 38.1 |
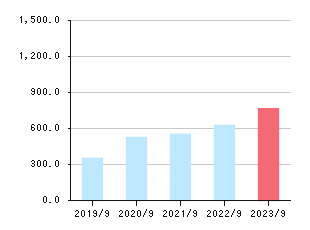
| EPS (yen) | 552.40 | 626.24 | 763.72 | 782.60 | 875.20 |
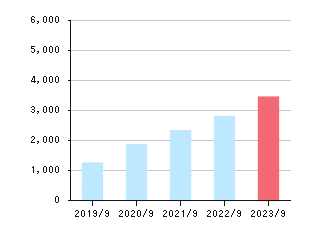
| Net assets per share (yen) | 2,329.72 | 2,802.19 | 3,448.66 | 3,982.75 | 4,777.42 |
* The company conducted a 2-for-1 stock split of common stock with an effective date of July 1, 2015. These figures were retroactively adjusted to reflect the stock split.
* The company conducted a 2-for-1 stock split of common stock with an effective date of
October 1, 2019. These figures were retroactively adjusted to reflect the stock split.
* The company conducted a 2-for-1 stock split of common stock with an effective date of
October 1, 2019. These figures were retroactively adjusted to reflect the stock split.

